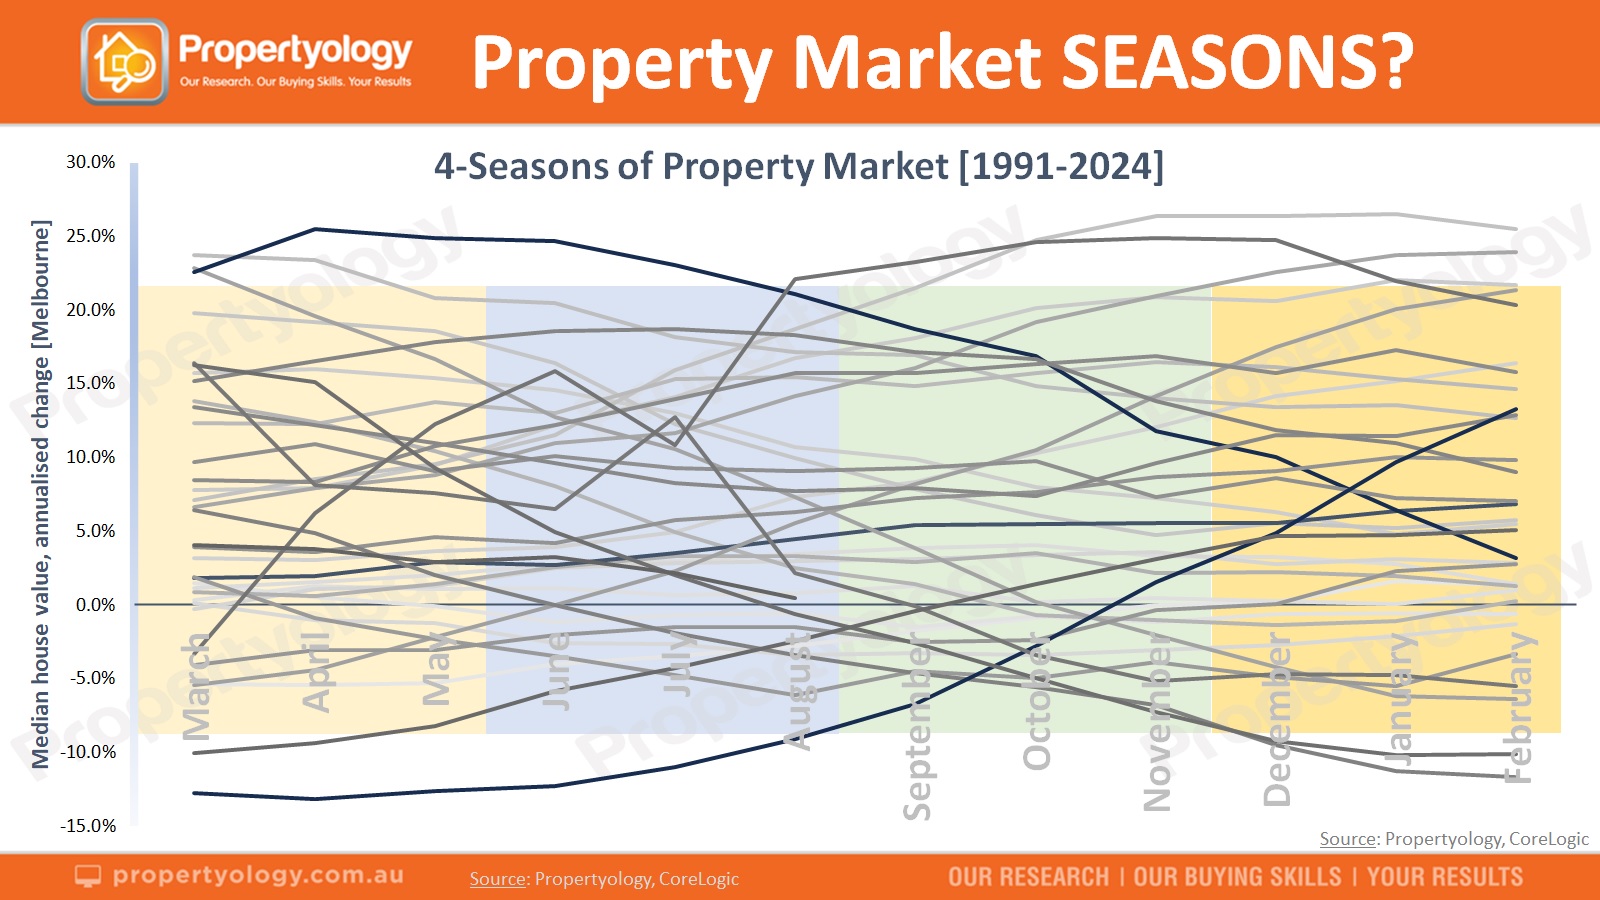
If you think this chart looks like a mess, that’s because it is. The absence of a clear pattern is compelling proof that some people’s perception is utter nonsense.
Extraction of the official statistics to produce this chart proves, beyond all doubt, that there is zero correlation between the 4-seasons of a year and changes to real estate values.
Autumn, Winter, Spring and Summer… 132 individual seasons across 33-years produced a liquorice-all-sorts collection of housing capital growth rates.
The pattern in this chart is as mad as the muddled minds of those who believe fake news like these each year:
- ‘Property prices cool during winter’
- ‘Buyers spring into action and the market blooms’
- ‘Red hot summer real estate’
Some of the nonsense that people carry on with is as if they believe housing is some kind of exotic plant that requires precise weather conditions to grow.
Housing is timber, steel, concrete, copper, zinc and terracotta…. They don’t grow and shrink at different times of the year.
While there are a few seasonal factors which have a mild influence on real estate matters, it is extremely shallow intelligence to think that humans make some of their biggest decisions with a heavy influence from leaf litter, flower buds, sunshine and rain.
Property market insights: SUBSCRIBE HERE
Who buys property?
- Within a given year, the biggest cohort of real estate buyers (42 percent of all transactions) are those that we refer to as ‘secondary buyers.’ These are existing owner-occupiers who satisfy their changing circumstances and desires through a different home.
The stereotypical homeowner remains in the same domicile for 7 to 10 years.
Falling autumn leaves or a gradual increase in daily temperatures do not dictate when someone upgrades their home.
- The next 30 percent of transactions are the buyers who supply 91 percent of Australia’s rental pool.
An aspirational adult with the financial capacity to do something positive for their financial future is not going to disregard rock solid property market fundamentals and delay their property investment decision until the cold weather disappears.
The best locations to invest in: CONTACT US
- The 100,000+ people per year (or 21 percent of buyers) who’ve exercised financial discipline, saved their deposit and organised a home loan approval to become a first home buyer quite rightly move as quick as they can, whether it is summer or winter.
- Only 7 percent of buyers are overseas migrants.

Rental seasons
Seasonal factors have a bigger influence on the rental market (rent prices and vacancy periods) than on asset values (buying and selling).
The logistics of tenant movements is more fluid than assets changing hands. For a variety of reasons, the average time for tenants to move is every 2 or 3 years and it requires significantly less preparation.
Specific to rental seasonal factors, the evidence confirms three (3) things:
- December is the least popular month of the year for tenant movements.
Beware the naïve, so-called ‘expert’ who uses fingernail deep ‘analysis’ to jump to a wild conclusion about a ‘softening of rental conditions in December.’ Legitimate property market experts know that there is a sizeable spike in vacancy rates every December [refer below chart].
Being under the pump with end-of-year work deadlines, a busier than normal social calendar and an understandable preference to avoid moving home directly before Christmas is the primary reason.
- January and February are the months with the highest level of tenant turnover. Think university and school start dates, along with some job transfers.
- The months close to the middle of the orange columns in the below chart confirm seasonally higher vacancy rates during winter. Shorter and cooler days is an innate human ‘hibernation’, producing noticeably fewer tenant movements.

Buying and selling seasonal factors
It takes considerable effort (emotionally and physically) for a property owner to prepare their property for sale and to keep it looking schmick during a 4 to 6-week sales campaign period.
As illustrated in the next chart, official evidence confirms two (2) seasonal trends for the volume of properties listed for sale [resale housing supply]:
- November often has a significantly higher volume of stock on the market than a few months earlier, and
A surge in properties on the market in Spring is related to slightly longer (sunlight) days along with completion of children’s winter sport competitions. That creates more time for vendors to prepare their property for sale during September and put it on the market during mid-October or November.
- January almost always has significantly fewer properties for sale than the months either side of it.
The timing of the festive season often influences vendors delaying their property being placed on the market. An owner who makes the decision to sell a property in (say) mid-November will often intentionally delay putting it on the market until mid-January [the orange columns in the chart below].

Seasonally higher levels of housing supply for sale is often matched by an increase in buyer activity.
A small percentage of buyer’s motivational levels are influenced by the better conditions to attend Open Home inspections and New Year’s resolutions.
The factors which have the biggest influence on an enormous critical mass of buyers and sellers have nothing to do with seasons and the weather.
Go back and review the abstract mess from the 132-seasons in our very first chart for the (indisputable) evidence.
Having confidence in one’s employment stability and income, the ability to raise a big enough deposit (from equity or cash savings), the cost of credit, the banks preparedness to approve credit, tax policies, rental policies, various housing incentives, local events, tax policies, general consumer confidence versus uncertainty are considerations for 365-days of the year.

Propertyology are national buyer’s agents and Australia’s premier property market analyst. Every capital city and every non-capital city, Propertyology analyse fundamentals in every market, every day. We use this valuable research to help everyday Aussies to invest in strategically-chosen locations (literally) all over Australia. Like to know more? Contact us here.
Here’s how we combine our thought-leading research with Propertyology’s award-winning buyer’s agency services.


